The Server Statistics Report provides the following line charts:
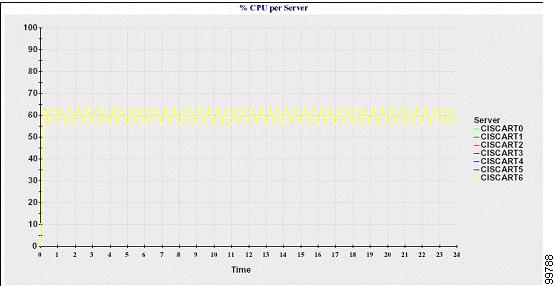
Percentage of CPU per Server
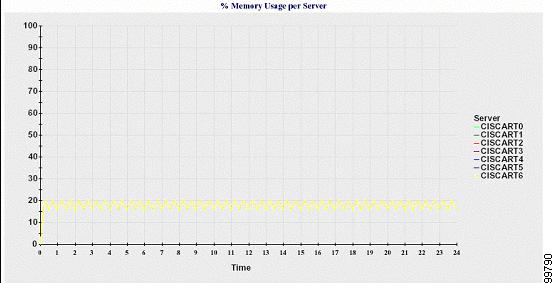
Percentage of Memory Usage per Server
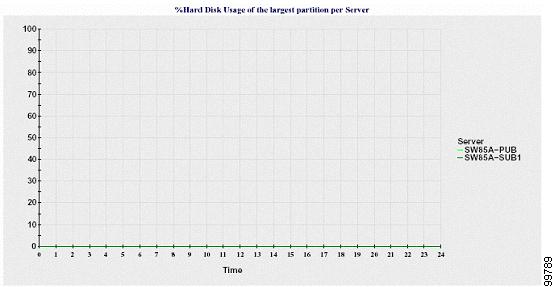
Percentage of Hard Disk Usage of the Largest Partition per Server
Cluster-specific statistics are only supported by Cisco Unified Communications Manager and IM and Presence Service.
Percentage of CPU Per Server
A line chart displays the percentage of CPU usage for the server (or for each server in a cluster). The line in the chart represents the data for the server (or one line for each server in a cluster) for which data is available. Each data value in the chart represents the average CPU usage for a 15-minute duration. If no data exists for the server (or for any one server in a cluster), Reporter does not generate the line that represents that server. If there are no lines to generate, Reporter does not create the chart. The message "No data for Server Statistics report available" displays.
Percentage of Memory Usage Per Server
A line chart displays the percentage of Memory Usage for the Cisco Unified Communications Manager server (%MemoryInUse). In a Cisco Unified Communications Manager cluster configuration, there is one line per server in the cluster for which data is available. Each data value in the chart represents the average memory usage for a 15-minute duration. If no data exists, Reporter does not generate the chart. If no data exists for any server in a cluster configuration, Reporter does not generate the line that represents that server.
Percentage of Hard Disk Usage of the Largest Partition Per Server
A line chart displays the percentage of disk space usage for the largest partition on the server (%DiskSpaceInUse), or on each server in a cluster configuration. Each data value in the chart represents the average disk usage for a 15-minute duration. If no data exists, Reporter does not generate the chart. If no data exists for any one server in a cluster configuration, Reporter does not generate the line that represents that server.
The server (or each server in a cluster configuration) contains log files that match the filename pattern ServerLog_mm_dd_yyyy_hh_mm.csv. The following information exists in the log file: