The Alert Summary Report provides the details of alerts that are generated for the day.
Cluster-specific statistics are supported only by Cisco Unified Communications Manager and IM and Presence Service.
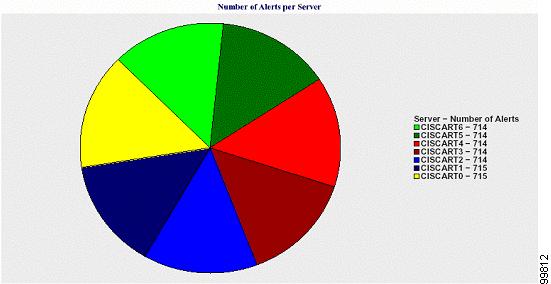
Number of Alerts Per Server
A pie chart provides the number of alerts per node in a cluster. The chart displays the serverwide details of the alerts that are generated. Each sector of the pie chart represents the number of alerts generated for a particular server in the cluster. The chart includes as many number of sectors as there are servers (for which Reporter generates alerts in the day) in the cluster. If no data exists for a server, no sector in the chart represents that server. If no data exists for all servers, Reporter does not generate the chart. The message "No alerts were generated for the day" displays.
Cisco Unity Connection only: A pie chart provides the number of alerts for the server. The chart displays the serverwide details of the alerts that are generated. If no data exists for the server, Reporter does not generate the chart. The message “No alerts were generated for the day” displays.
The following chart shows a pie chart example that represents the number of alerts per server in a Cisco Unified Communications Manager cluster.
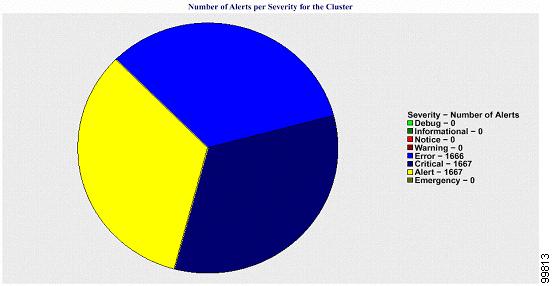
Number of Alerts Per Severity for the Cluster
A pie chart displays the number of alerts per alert severity. The chart displays the severity details of the alerts that are generated. Each sector of the pie chart represents the number of alerts that are generated of a particular severity type. The chart provides as many number of sectors as there are severities (for which Reporter generates alerts in the day). If no data exists for a severity, no sector in the chart represents that severity. If no data exists, Reporter does not generate the chart.
The following chart shows a pie chart example that represents the number of alerts per severity for a Cisco Unified Communications Manager cluster.
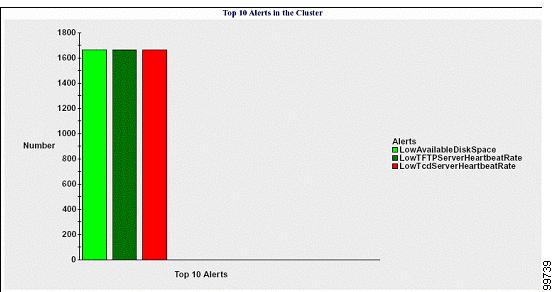
Top Ten Alerts in the Cluster
A bar chart displays the number of alerts of a particular alert type. The chart displays the details of the alerts that are generated on the basis of the alert type. Each bar represents the number of alerts for an alert type. The chart displays details only for the first ten alerts based on the highest number of alerts in descending order. If no data exists for a particular alert type, no bar represents that alert. If no data exists for any alert type, RTMT does not generate the chart.
The following chart shows a bar chart example that represents the top ten alerts in a Cisco Unified Communications Manager cluster.
The server (or each server in a cluster) contains log files that match the filename pattern AlertLog_mm_dd_yyyy_hh_mm.csv. The following information exists in the log file: